Custom Dashboards & Reporting Tools

Drowning in Spreadsheets? 
Get Real-Time Operational Control

Transform weeks of manual reporting into minutes of automated insight. See what’s happening across your operations right now — not last week.

When teams spend days preparing reports instead of analyzing results, operational control starts to slip.

Show Me How

The Real Cost of Manual Reporting Chaos

Click on the challenge that matches your situation to see how we solve it.

visibility icon

Lost Operational Control

You can't manage what you can't see in real-time.

policy alert icon

Compliance Headaches

Regulatory and internal reports take weeks to prepare and are prone to errors.

arrows icon

Decision-Making Paralysis

Critical decisions are delayed because data is scattered across disconnected systems.

Eye with a slash icon indicating hidden or not visible.

Business impact

Missed optimization opportunities.

Real cost

€50K+ in lost efficiency per quarter from reactive instead of proactive management

search illustration

Business impact

Delayed response to operational issues, missed optimization opportunities

Real cost

€30K+ per quarter in wasted effort and rework from manual report preparation, error corrections, and audit follow ups.

patch illustration

Business impact

Delayed response to operational issues, missed optimization opportunities

Real cost

€100K+ annually in missed opportunities and delayed actions caused by fragmented data and slow access to decision ready insights.

Let's discuss your specific challenge and outline 
a clear path forward.

Mateusz Wilczyński

CTO at Exlabs

Schedule a Technical Call
Portrait of a young man with short brown hair wearing a black V-neck shirt against a gray background.

Unified Data, Automated Insights

To regain operational control, we connect fragmented data sources into intelligent dashboards tailored to how your business actually operates.

Real-Time Data Integration icon

Real-Time Data Integration

We connect operational, transactional, and sensor-based systems into a single source of truth.

  • Automated data pipelines from core systems

  • Real-time synchronization and validation

  • Historical data retained for trend analysis

Intelligent Dashboard Design icon

Intelligent Dashboard Design

Custom interfaces designed around real workflows — not generic templates.

  • Role-based views for different stakeholders

  • Interactive visualizations for key KPIs

  • Mobile-responsive access for teams in the field

Automated Compliance Reporting icon

Automated Reporting

Generate audit-ready reports automatically instead of manually.

  • Metrics calculated and updated continuously

  • Pre-configured reporting templates

  • One-click report generation for stakeholders

Dashboards That Transform Your Operations

Based on experience delivering dashboards for complex organizations, these are some of the most impactful solutions we’ve built.

Interactive global map displaying various operational facilities categorized by metal types with filters on the left and a legend on the right; a pop-up details an aluminum smelter in Kazakhstan including costs, emissions, and production for 2025.

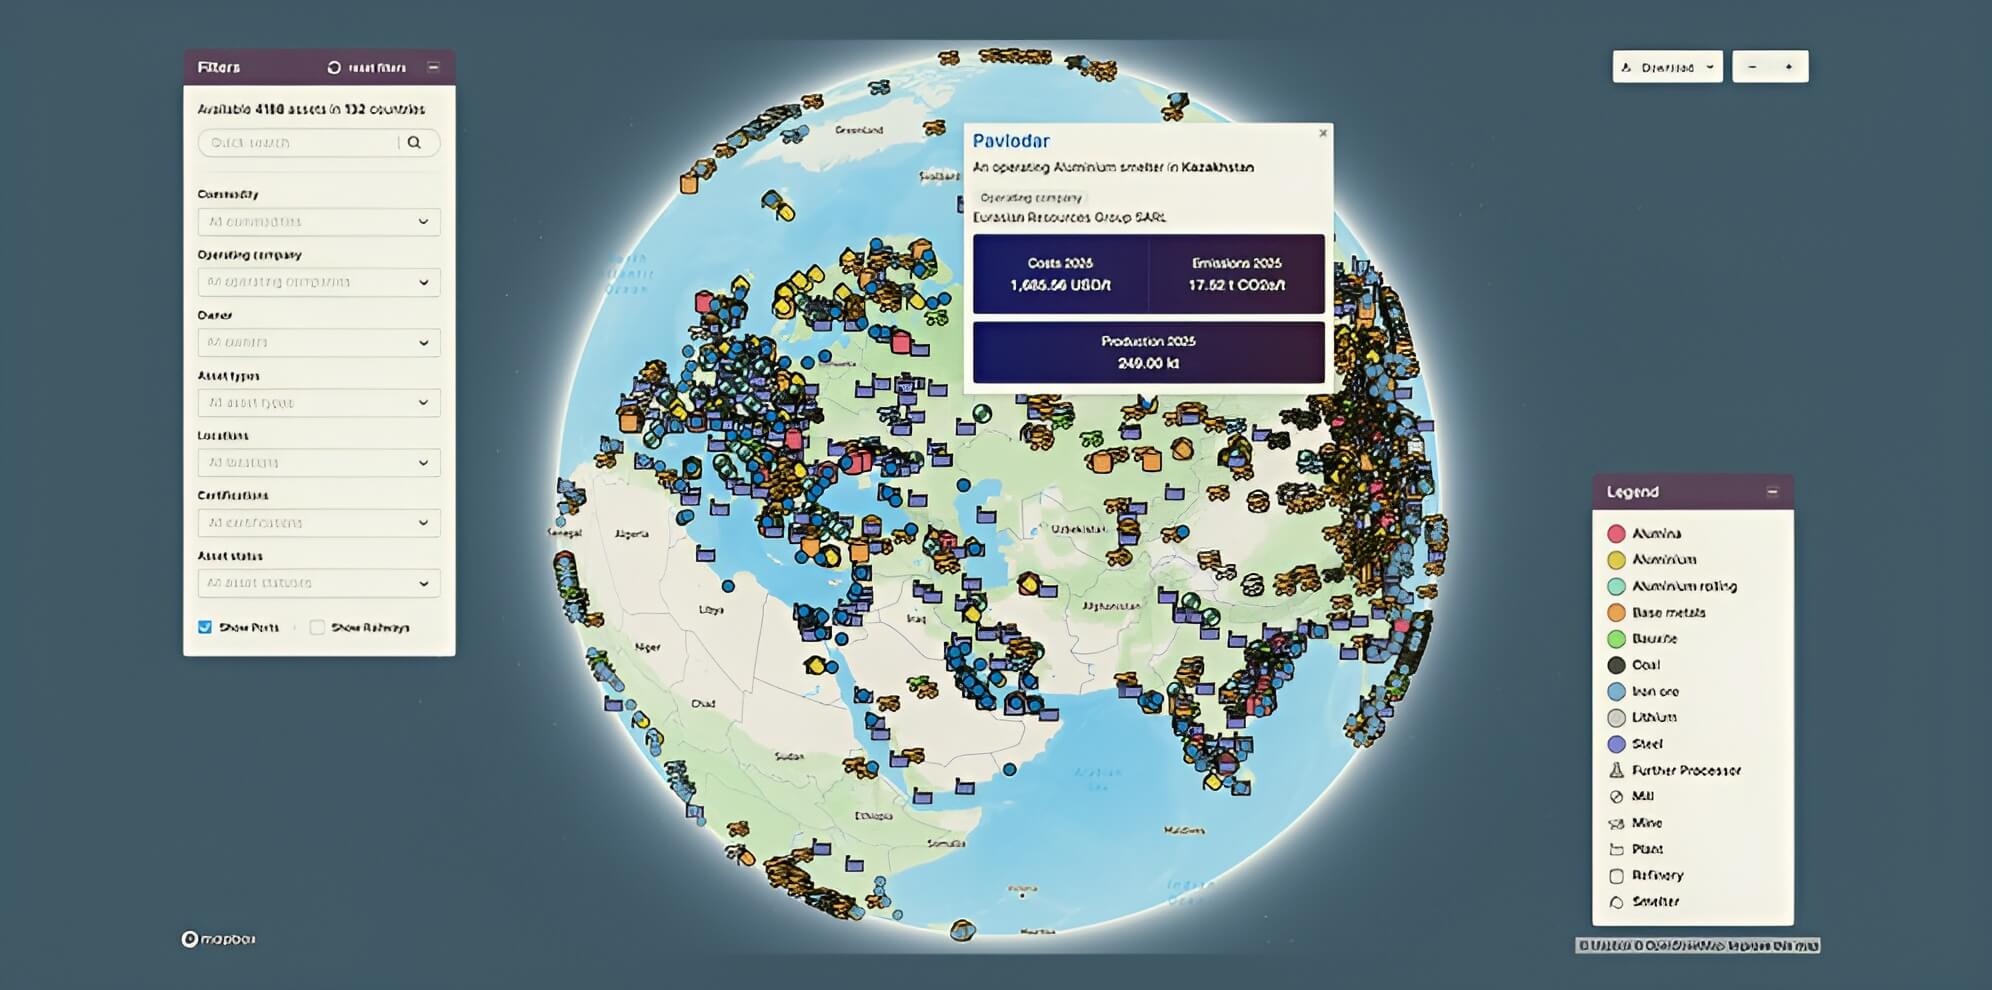
Operational & Asset Performance

Real-time visibility into performance, utilization, and anomalies across distributed assets.

Renewable Energy
Data Engineering
Cloud
Dashboard showing comparative bar charts of battery technology costs from 2023 to 2032 for LFP Graphite Prismatic (China) and Sodium Layered Oxide - Hard Carbon prismatic cell (EU).

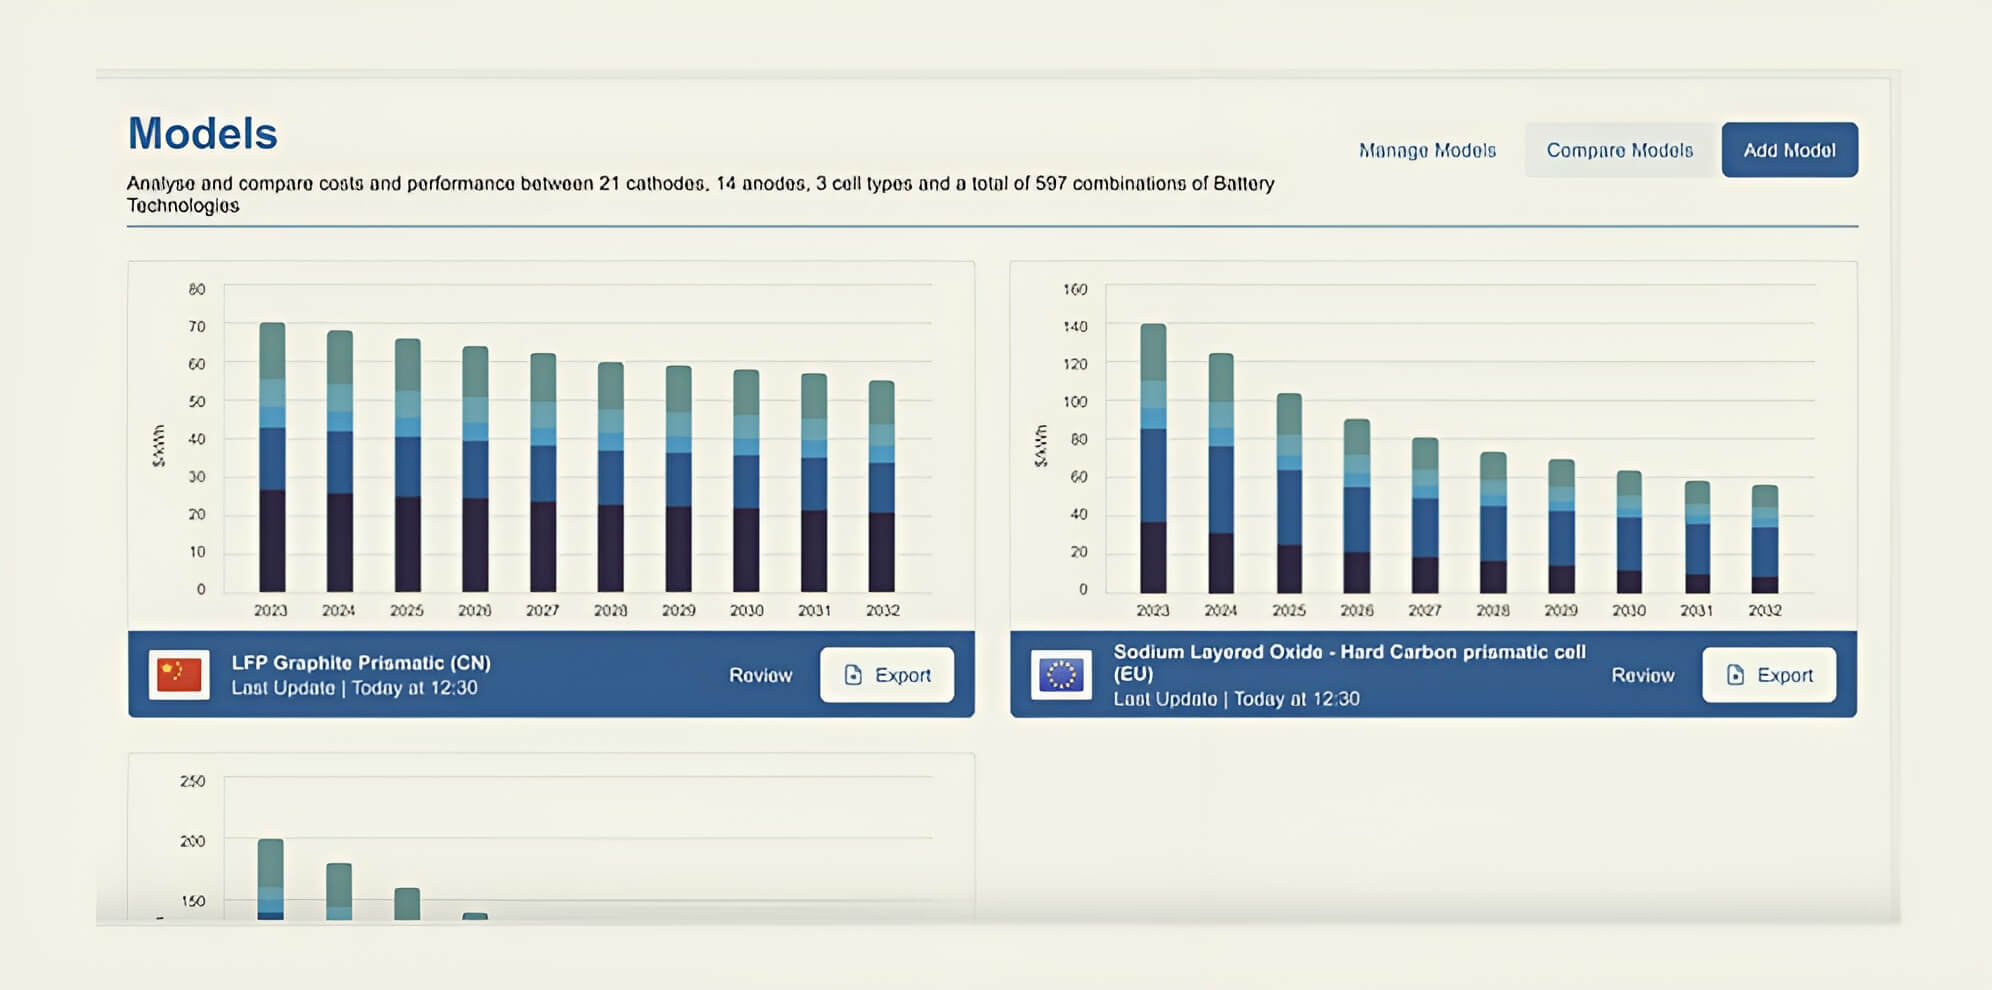
Resource Planning & Forecasting

Data-driven planning using historical trends and live operational inputs.

Resources
Data Engineering
Cloud
Previous
Next

Pragmatic and Proven Technology

Technology choices are guided by pragmatism and experience. The stack is selected to ensure reliability, performance, and long-term maintainability for critical systems.

Data & Analytics Engineering

Robust tools like Apache Kafka and Spark are utilized to handle complex streams and enable real-time analysis.

Abstract orange and black geometric shapes forming a stylized design.

D3.js

Bar chart with five vertical bars of varying heights and red dots connected with a line above the bars.

Plotly

Logo of GitLab consisting of an orange and pink geometric fox head.

Charts.js

Stacked bar chart displaying Power BI data visualization with color-coded bars.

Power BI

Grafana dashboard showing data visualization with various charts and graphs.

Grafana

Blue pixelated grid forming a rounded square with a missing lower-left corner.

Metabase

Airbyte company logo featuring stylized text with a blue and black color scheme.

Airbyte

Red folded paper origami shaped like a crab against a white background.

dbt

Airflow logo with three red, blue, and orange overlapping curved shapes forming a pinwheel design.

Airflow

Blue symmetrical snowflake icon with six branches.

Snowflake

Databricks logo consisting of an orange cube outline with a stylized data stack inside.

Databricks

Cloud & Infrastructure

Architecting on AWS and Azure with Infrastructure as Code (Terraform) for secure, automated, and repeatable environments.

Headshot of a bald man with beard and mustache, wearing a beige shirt, against a dark background.

Apache Kafka

Airbyte company logo featuring stylized text with a blue and black color scheme.

Airbyte

Red folded paper origami shaped like a crab against a white background.

dbt

Airflow logo with three red, blue, and orange overlapping curved shapes forming a pinwheel design.

Airflow

Blue symmetrical snowflake icon with six branches.

Snowflake

Databricks logo consisting of an orange cube outline with a stylized data stack inside.

Databricks

Small satellite orbiting Earth with a view of space in the background.

PostGis

Custom Software Development

Building on modern, scalable frameworks (Go, Python, TypeScript) and best practices like containerization with Docker.

React logo consisting of an atom-like shape with three elliptical orbits surrounding a central circle.

React.JS

Next.js logo with stylized 'N' and 'X' letters and 'NEXT.JS' text below.

Next.js

Red phoenix bird logo with stylized wings curved upward.

Nest.js

Blue TypeScript logo with white TS letters on a blue background.

Typescript

nodejs icon

Node.JS

Yellow square with the black letters 'JS' representing the JavaScript logo.

JavaScript

Pink icon of an airplane taking off.

GraphQL

Stylized blue elephant head with a curled trunk, representing the PostgreSQL logo.

PostgreSQL

Redis database logo with stylized red cube and white stacked lines design.

Redis

Python programming language logo with two intertwined snakes, one blue and one yellow.

Python

Docker logo featuring a blue whale carrying shipping containers on its back.

Docker

terraform logo

Terraform

terraform logo

Kubernetes

GitHub logo consisting of a black silhouette of an octocat with a round head inside a black circle.

Github Actions

Green stylized icon of a smiling face holding a large pencil, symbolizing creative writing or drawing.

Playwright

AWS logo with orange curved arrow and black letters.

AWS

Microsoft Azure logo with a stylized blue letter A.

Azure

Partnering with the Leading Cloud Platforms
Turning Technical Blueprints into Production Reality
google cloud logo

A Predictable Path to Production

Our process is designed for transparency and results. We turn requirements into production-ready software through a structured, four-step approach.

1

Technical Workshop 
& Scoping

  • Map your current reporting processes and pain points

  • Define critical KPIs with stakeholders

  • Identify data sources and integration requirements

  • Design dashboard mockups for key user roles

Outcome

Clear project scope and success metrics

Approved dashboard designs

Technical integration plan

2

Data Integration & Backend

  • Build secure connections to internal systems

  • Create automated pipelines and validation rules

  • Implement real-time data processing and storage

  • Set up monitoring and alerting

Outcome

Unified data platform feeding live operational data

Automated data quality checks and error handling

Foundation for all dashboard functionality

3

Dashboard Development

  • Build interactive dashboards based on approved designs

  • Implement role-based access and security

  • Create automated report generation capabilities

  • Develop mobile-responsive interfaces for field teams

Outcome

Working dashboards with real operational data

Automated ESG and compliance reporting

User-tested interfaces ready for deployment

4

Deployment & Training

  • Deploy to production environment with monitoring

  • Train operational teams and report users

  • Establish maintenance procedures and documentation

  • Provide ongoing support and optimization

Outcome

Live operational dashboards in daily use

Teams confident using new reporting capabilities

Documented processes for long-term success

Previous
Next

From Technical Blueprints to Production Reality

Real outcomes from production systems solving high-stakes operational challenges.

< 3 months

Decision cycles reduced

Accelerated strategic decisions by transforming months of analysis into real-time insights.

Learn how we accelerated decisions

3,000+

UK air quality zones automated

Eliminated manual workflows, enabling scalable, 
real-time operational oversight.

Learn how we built for scale

26+ GWhs

Battery storage operations optimized

Production-ready architectures enabling reliable, compliant, and efficient operations.

Learn how we handled complexity

Our Work in Production

Explore how custom software and data platforms are developed to solve complex challenges for leaders in the energy and resources industry.

From Complex Data to Competitive Dominance

How CRU Group partnered with Exlabs to de-risk large-scale investment decisions through production-ready data platforms.

90% Reduction in Analysis Time
Rows of green Gogoro electric scooter battery packs in white charging slots.White uppercase letters CRU on a blue gradient square background with rounded corners.

Emobility infrastructurefor CleanAirZones around 
UK Local Authorities

We built a scalable, serverless infrastructure enabling the UK Government to control vehicle access to Clean Air Zones nationwide.

City skyline with modern skyscrapers reflecting on calm water at sunset with partly cloudy sky.Flowchart illustrating the departmental workflow from 'Admission' to 'Heart Department' with icons representing different stages.

The Asset Platform 
GIS & UX Upgrade Story

Major GIS and UI upgrade with globe view, optimised performance, and enhanced UX—resulting in smoother navigation and better asset insights.

Satellite view of Earth showing the Indian subcontinent, Arabian Peninsula, and surrounding regions with city lights visible at night.White uppercase letters CRU on a blue gradient square background with rounded corners.

Scaling Open-Source Grid Insights Across Europe

Turning raw grid data into actionable, open-source intelligence

Silhouette of a high-voltage electricity transmission tower against a blue sky with pink and gray clouds at sunset.
Explore more of our projects
Previous
Next

Frequently Asked Questions

Everything you need to know before you decide to work with us.

We typically start within 2–3 weeks from the first conversation. The timeline depends on how quickly we can run the technical assessment workshop (usually within a few days) and finalize the commercial agreement.

For urgent situations, we’ve started projects in as little as one week. We never skip discovery — rushing into development without proper scoping leads to costly delays later.

Your project team usually consists of 2–4 people depending on scope: a Technical Lead, a Frontend or Data Engineer, and a Project Manager. For complex initiatives, we add specialists as needed.

You’ll meet your dedicated team during kickoff, and they remain your consistent points of contact throughout the project.

We work in two-week sprints with clear milestones. You’ll have a weekly check-in call to review progress and priorities. Between calls, communication happens via Slack or email.

At the end of each sprint, you see working software — not just status updates.

For well-defined projects, we offer fixed-price delivery with milestone-based payments.For exploratory work, we use time-and-materials with a clear monthly budget cap.

We’re transparent about costs from day one and flag any scope changes early.