Data Visualisation dashboard
for advanced GPU database

Sectors

Big data, GPU databases

Technologies

React+Redux, PostgreSQL, Ruby, Docker

Country

United Kingdom

Challenge

Brytlyt is a GPU database and analytics platform, with patent pending IP, that is transforming the way businesses use data. Multibillion datasets can now be queried in seconds, at massively reduced cost. With a data processing speed that is 300 times faster than traditional systems within hours of deployment, Brytlyt’s GPU-powered platform provides real time insights on large and streaming data sets. Brytlyt has however continued to struggle to demonstrate the capabilities of its flagship product, MakuluDB, to its end users. Despite its technical superiority, decision makers could not easily relate MakuluDB’s benefits to their organisational challenges.

Process & Scope of Work

We’ve identified that the problem can be resolved by allowing the users to instantly visualise their datasets and obtain valuable insights from them. We have opted for utilising raw and GPS datasets to design the Spotlyt Business Intelligence Dashboard which renders and plots the data seamlessly.

Results

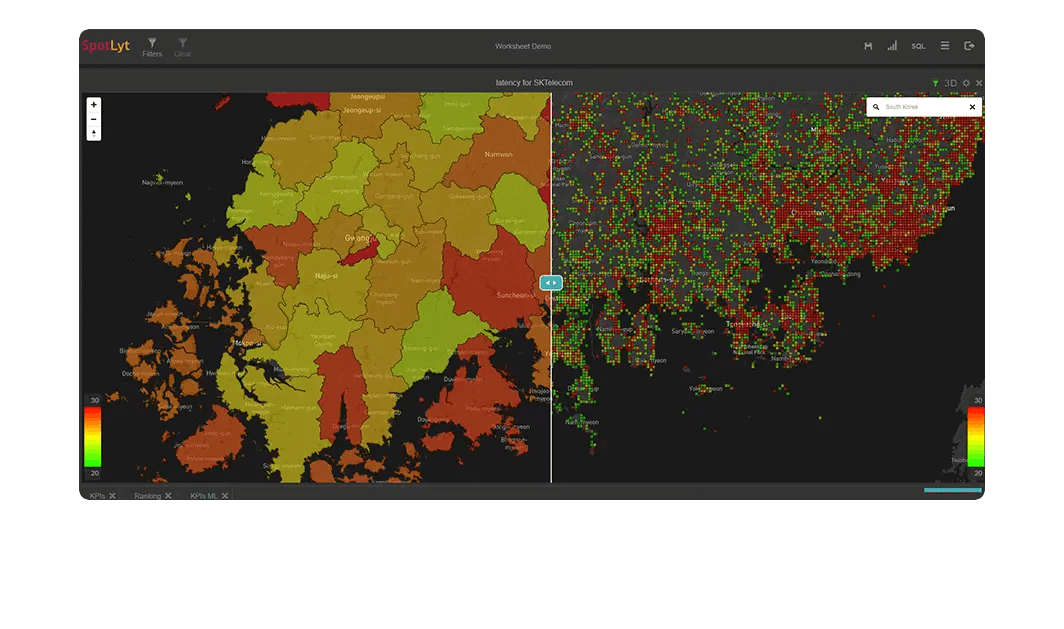
Since SpotLyt uses Brytlyt’s own data rendering engine to visualize billion row datasets, analysts can now get a holistic and detailed point of view at their fingertips.


Because SpotLyt is built on the open source Plotly platform, not only were we able to deliver the MVP within 4 weeks of inception, the analysts will have the ability to add any custom visualization or dashboard that their business requires easily and quickly while using the Brytlyt database gives real-time user experience.

Would you like to be up to date?

Keep up with Exlabs Weekly Newsletter!


    By clicking “Subscribe” you accept the Privacy Policy.